LiveView Pro Course Update: Mapping Demo
October 23, 2020
Howdy again, friends!
First, many thanks for all your positive responses about the charting demo we sent out last week. We’ve made a couple small tweaks based on your suggestions, but otherwise it sounds like we’re on the right track. It’s encouraging to hear that this example will be useful to those of you looking to do real-time charting with a JS library. 📊 📉
Continuing with JS interop, let’s do some mapping!
🌎 No surprise, charting and mapping examples were the two big requests when it came to JS interop.
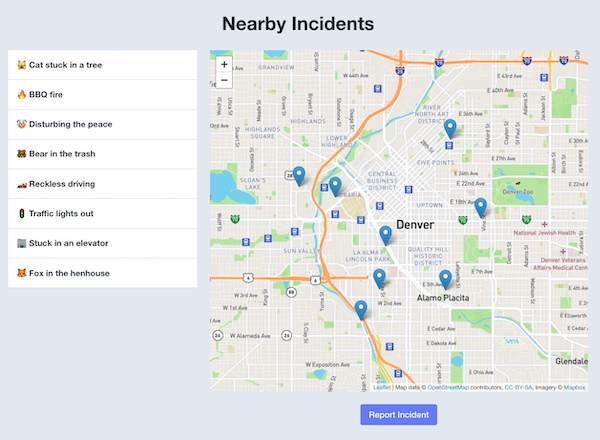
So we’ve been working hard on a mapping example that we think really showcases some unique JS interop features of LiveView. It renders a map with markers for incidents that need attention in your area: 🔥 BBQ fire , 🐻 Bear in the trash, 🙀 Cat stuck in a tree , and so on.
Of course time is of the essence when it comes to emergencies, so everything is updated in near real-time. Seeing up-to-date reports of what’s going on nearby gives everyone an opportunity to pitch in and help!
Two-way, real-time interaction.
This example demonstrates an interesting back and forth between the LiveView and the map:
-
Selecting an incident from the list centers that incident’s marker on the map and shows a popup with a description.
-
Clicking a marker on the map highlights the corresponding incident in the list, scrolling the list if necessary to bring the selected incident into view.
-
Reporting an incident broadcasts a message which adds the new incident to the list and drops a marker on the map. Go ahead and hit that “Report Incident” button (we know you want to!) and you’ll see a random dog or cat in trouble.
-
And if you open two browser windows, you’ll see real-time updates across sessions so everyone’s in the loop!
To get this two-way interaction, we’re pushing events both ways across the websocket: from the LiveView running on the server to the JS hook running in the browser, and vice versa. We also used a new LiveView feature to reply to a pushed event, which turns out to be super handy. 👍
The specific JS mapping library doesn’t really matter.
We’re using the leaflet library since many of you recommended it. However, we’ve encapsulated all the leaflet-specific code in a JS class with a simple API. It lets you create a map, add a marker to the map, and pan the map to center a marker.
Any mapping library worth its salt will let you do those three basic things. So you could easily adapt this example to use OpenLayers, Google Maps, or your favorite mapping library.
All the good stuff as far as we’re concerned happens in the JS hook we write from scratch. It’s a thin layer that effectively connects the LiveView and whatever JS mapping library you use.
Now here’s a little secret.
We could easily branch out from here into all sorts of examples that demonstrate JS interop. And indeed we have a few choice examples we aim to explore later in the Pro course. (Alpine, anyone?)
But based on what you’ll learn in the charting and mapping examples, the world (as they say) will be your oyster. 🦪 😋 Once you know about pushing interaction events back and forth between a LiveView and a JS hook, you can use them to build pretty much whatever you want.
So even if you don’t plan to do any charting or mapping, we think you’ll get a lot of value out of these two examples. Think of them as meta-skills that have a longer shelf life than just knowing how to make a chart or map. 😀
Let us know what you think!
-
Does this example align with what you’re wanting to learn and do?
-
Any changes that would make this example more useful to you?
-
Did we overlook anything that would be generally applicable?
Thanks again for your interest in the Pro course! 🤟